Tabla de contenidos
- What Is Route Optimization?
- Route Planning vs. Route Optimization: What’s the Real Difference?
- How Route Optimization Software Works
- Why Route Optimization Looks Different for Bus Operators Than for Delivery Fleets
- Where Bus Operators Actually Save Money With Route Optimization
- What to Look for in Route Planning Software for a Bus Fleet
- How to Start Optimizing Your Routes Without Disrupting Service
- Frequently Asked Questions
What Is Route Optimization?
Route optimization is the process of using software and algorithms to design the most efficient route for a vehicle or fleet, factoring in distance, time, fuel cost, driver availability, vehicle capacity, traffic, and operational constraints. The goal is not to find the shortest path, but the one that delivers the best balance of cost, time, and service for the business and its passengers.
For bus operators, that distinction is crucial. A delivery van wants to drop 30 packages and return to the depot as fast as possible. A coach bus needs to leave at a scheduled time, stop at intermediate terminals on a fixed itinerary, comply with driver hours-of-service rules, and arrive on time with paying passengers on board. The optimization problem is fundamentally different, and that is why generic routing tools often fall short for passenger transport.
Route Planning vs. Route Optimization: What’s the Real Difference?
These terms get used interchangeably, but they describe very different things. Mixing them up is one of the most common reasons operators end up with software that does not deliver the savings they expected.
- Route planning is the act of creating a route. A dispatcher draws a sequence of stops between point A and point B. It can be done on paper, in a spreadsheet, or with basic mapping software.
- Route optimization is the act of finding the best possible route. It evaluates millions of permutations against business rules (cost, time windows, capacity, driver hours, fuel) and returns the one that scores highest.
Put another way: planning answers “Can we get there?” Optimization answers “What is the smartest way to get there given everything we know today?” In a small operation with two buses and three daily routes, planning may be enough. Once a fleet grows past 10 vehicles and multiple daily departures, manual planning starts leaving money on the table.
How Route Optimization Software Works

Route optimization software does in seconds what a human dispatcher could not do in a week. The math scales fast: a single vehicle with 10 stops has 3,628,800 possible orderings, and a fleet of 5 vehicles serving the same stops generates more than 37 quadrillion combinations, according to Verizon Connect. No human can compare all of them. Algorithms can.
The process has four core steps:
- Data collection. The system gathers every relevant input: terminal locations, intermediate stops, scheduled departure times, vehicle types and capacities, driver shifts and remaining hours of service, traffic data, fuel prices, and any contractual or regulatory constraints.
- Problem formulation. The scenario gets framed as a mathematical model, typically a variation of the Vehicle Routing Problem (VRP) or the Traveling Salesman Problem (TSP), with the operator’s specific objectives and constraints.
- Algorithmic search. Using techniques like genetic algorithms, simulated annealing, or heuristic search, the software evaluates millions of route combinations and ranks them by total cost.
- Output and adjustment. The system produces the best route or schedule, displays it visually, and allows the dispatcher to review, adjust, or push it directly to drivers. Modern systems also adjust in real time when conditions change: a crash on the highway, a delayed connecting bus, a driver running out of hours.
The quality of the result depends entirely on the quality of the data going in. Garbage data produces garbage routes, no matter how sophisticated the algorithm.
Why Route Optimization Looks Different for Bus Operators Than for Delivery Fleets
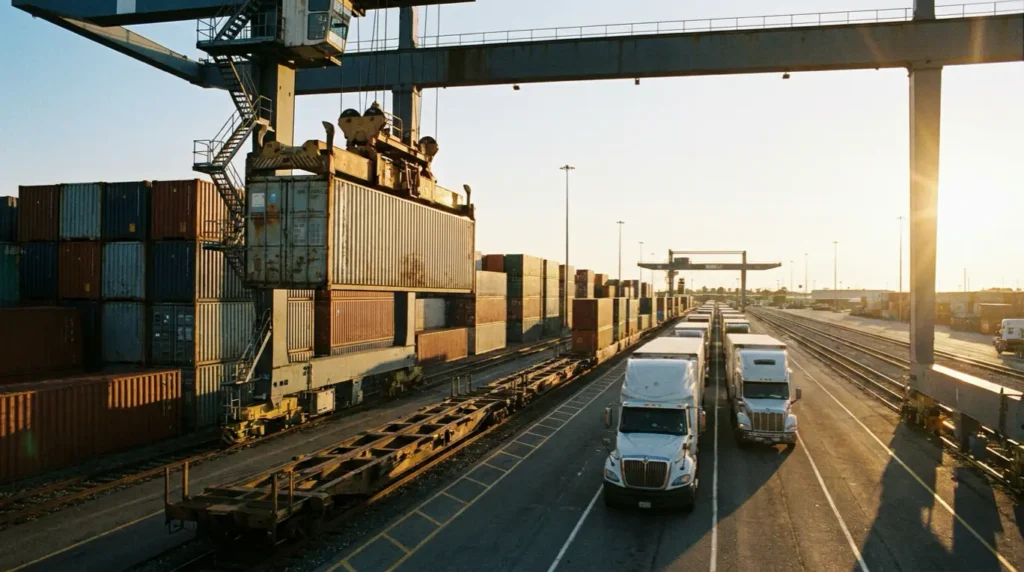
Most route optimization software on the market was built for delivery and last-mile logistics. The constraints are different enough that bus operators need to look carefully at what a given tool actually handles.
A delivery fleet optimizes around stops that can be moved, reordered, or even dropped. A bus fleet optimizes around stops that are mostly fixed (terminals, intermediate stations, passenger pick-up points) and around departures that customers have already bought tickets for. The variables a bus operator can actually move are different: which driver takes which route, which vehicle goes on which schedule, how to position empty buses between trips (the “deadheading” problem), how to recover when one bus runs late and threatens connections downstream.
Other constraints specific to passenger transport include:
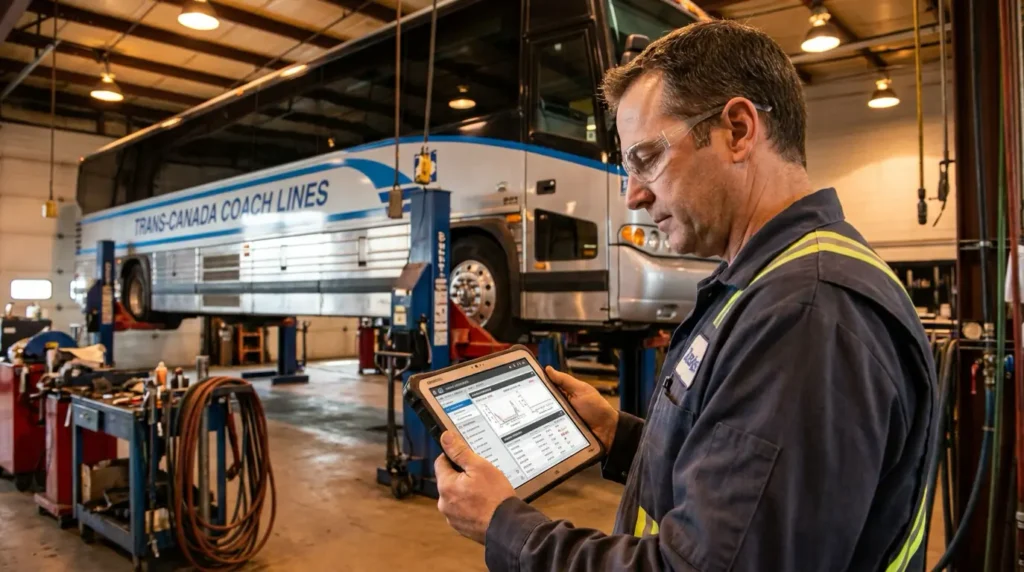
- Driver hours-of-service compliance. In the United States, FMCSA rules limit passenger-carrying drivers to 10 hours of driving after 8 consecutive hours off-duty. In the European Union, Regulation EC 561/2006 caps daily driving at 9 hours, extendable to 10 hours twice a week. A route that violates these rules can void insurance and trigger regulatory penalties. Operators who already use driver behavior monitoring tools have an advantage here, since the same telematics data feeds both systems.
- Vehicle type matching. A coach bus, a minibus, and a double-decker have different fuel profiles, passenger capacities, and accessibility features. Assigning the right vehicle to the right route is part of optimization.
- Schedule reliability. Bus passengers expect departures and arrivals to match published timetables. An “optimized” route that shaves 8 minutes off the trip but misses the published arrival time is worse than the original.
- Multi-modal connections. Many bus passengers rely on connections to other buses, trains, or flights. A route that arrives 5 minutes after a connection departs has destroyed value, not created it.
A good route optimization tool for buses understands these constraints. A generic one ignores them and produces plans that look great in theory but break in practice.
Where Bus Operators Actually Save Money With Route Optimization

The published case studies and industry reports point to a consistent range of savings when bus and fleet operators move from manual planning to optimized routing. The exact numbers vary with starting maturity, but the patterns are clear.
- Fuel costs. Operators typically see fuel savings of 10 to 25% within the first 90 days of implementation, according to 2026 industry data. The savings come from shorter total distance, less idling, and smoother routes that avoid stop-and-go traffic.
- Planning time. Bus route software vendors report up to 75% reductions in the time dispatchers spend building schedules and routes. That time gets reinvested in handling exceptions and improving service quality.
- Driver overtime. When routes account for driver hours of service, fewer trips end with a driver in overtime. A 2025 field-service study from Timefold found drive-time reductions of 15 to 30%, with proportional cuts in overtime hours.
- Vehicle utilization. Better routing distributes work more evenly across the fleet, which means fewer vehicles sitting idle and lower per-trip fixed costs. Some operators reduce the number of buses needed to cover the same service without affecting reliability.
- On-time performance. Fewer late arrivals means fewer compensation claims, less customer churn, and stronger ratings on booking platforms.
A 600-truck case study from Heartland (reported by FleetRabbit, 2026) showed a 31% fuel reduction and $4.8M in annual savings after deploying AI-driven route optimization, with the implementation paying for itself in six weeks. Bus fleets running long-distance routes report similar percentages. The dollar figures change with fleet size, but the percentages translate.
What to Look for in Route Planning Software for a Bus Fleet
Not every tool labeled “route optimization” or “route planning software” fits passenger transport. Before evaluating vendors, decide which of these capabilities the operation actually needs:
- Fixed-route and on-demand support. A good system handles scheduled interprovincial routes and irregular charter or shuttle work in the same platform.
- Time-window enforcement. The software must respect published departure and arrival times, not just minimize travel time.
- Driver shift and HOS integration. Routes should be built against the real availability of each driver, not against an idealized schedule.
- Vehicle assignment logic. The system should match the right vehicle (capacity, fuel type, amenities) to each route, not just the closest one.
- Real-time rerouting. When a road closes, a vehicle breaks down, or a driver misses a connection, the system should propose alternatives within minutes.
- Integration with the rest of the operation. Ticketing, fleet maintenance, accounting, and customer communications all depend on the route plan. A standalone routing tool that does not connect to those systems creates more work, not less.
- Reporting that surfaces the right metrics. Cost per route, fuel per kilometer, on-time arrival rate, vehicle utilization, and driver overtime should be visible without manual exports.
For operators evaluating their first system, the integration question matters most. A purpose-built transport management system for bus operators usually combines fleet route planning with ticketing, fleet management, and reporting in one platform. Adding a routing tool on top of disconnected systems often creates the wrong kind of complexity.
How to Start Optimizing Your Routes Without Disrupting Service
Operators who try to overhaul every route at once almost always regret it. A phased approach delivers most of the savings with far less risk:
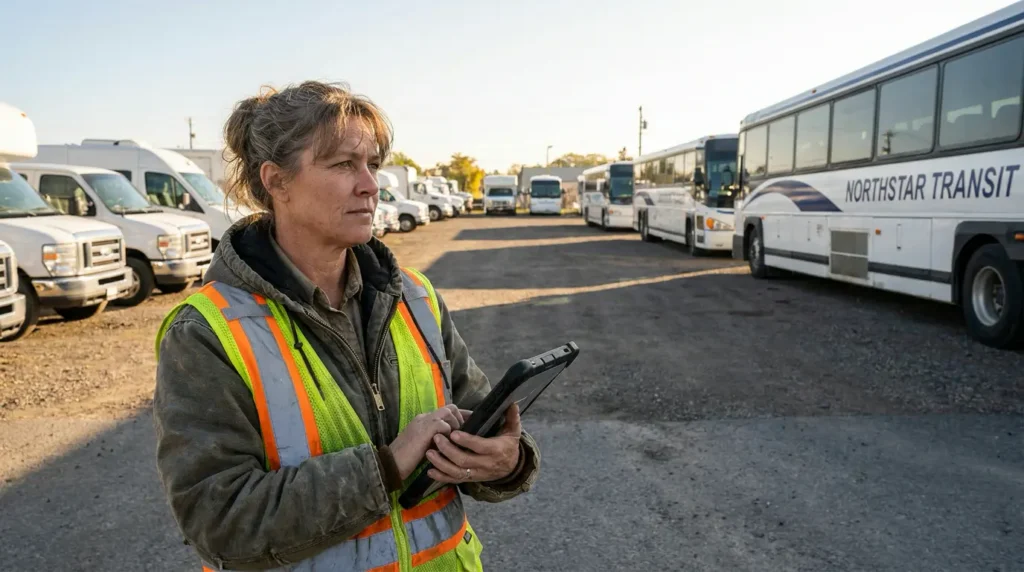
- Map the current state. Document every existing route: stops, scheduled times, vehicle assignments, driver assignments, fuel costs, on-time rates. Without this baseline, no one will know whether optimization is actually working.
- Pick a controlled pilot. Start with a single corridor or service line that has visible inefficiencies. Avoid the most strategic route until the team has confidence in the system.
- Run the pilot for at least 60 to 90 days. Industry data shows most operational fuel savings stabilize in the first three months. Anything shorter and the data is too noisy to draw conclusions.
- Measure against the baseline. Compare actual fuel use, on-time rate, driver overtime, and total trip cost before and after.
- Scale to the rest of the network. Once the pilot shows results, expand corridor by corridor. Train dispatchers along the way, not after the fact.
- Keep optimizing. Traffic patterns, fuel prices, regulations, and customer demand all change. A route optimized in January may not be optimal in June.
The operators who get the most out of these tools treat optimization as an ongoing practice, not a one-time project.
Frequently Asked Questions
Is route optimization the same as GPS navigation?
No. GPS navigation gives turn-by-turn directions along a route someone has already chosen. Route optimization decides which route to take in the first place, balancing dozens of factors a GPS app does not consider, including driver hours, vehicle capacity, fuel cost, and scheduled departures.
How much does route optimization software cost?
Pricing varies widely. Standalone routing tools for small fleets start around $50 to $200 per vehicle per month. Full TMS platforms with built-in optimization run higher but include ticketing, fleet management, and reporting. For most bus operators, integrated platforms deliver better total ROI than standalone routing tools.
How long does it take to see results?
Most published studies show measurable fuel and time savings within 30 to 90 days of deployment, assuming the input data is clean. Full ROI typically arrives in 6 to 12 months.
Can route optimization handle real-time changes like traffic or breakdowns?
Modern systems can. Real-time rerouting is now standard in most fleet route planning platforms, but the depth varies. Some only reroute around traffic; others handle driver swaps, vehicle reassignment, and connection recovery automatically.
Do I need to be a tech company to use it?
No. Modern route optimization tools are built with dispatcher-friendly interfaces. The bigger investment is in clean operational data (accurate routes, driver schedules, vehicle specs) rather than technical skill.
Most bus operators do not lose money because they are picking the wrong route. They lose money because they are managing routing, ticketing, fleet, and accounting in separate systems that do not talk to each other. QuatroBus brings all of it into one platform built specifically for passenger transport operators, so route optimization actually informs every other decision in the business.